Why In News?
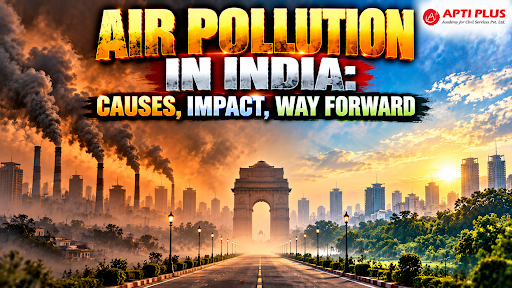
The National Clean Air Programme (NCAP) Progress Report 2026, by Centre for Research on Energy and Clean Air (CREA), revealed that 68% of 130 non-attainment cities failed to achieve targeted particulate matter reductions despite spending ₹16,423 crore in public funds.
What Is The Current Scale Of India's Air Pollution Crisis?
Mortality Burden Across States: Air pollution caused 1.67 million premature deaths in India in 2019, accounting for 17.8% of total national mortality, establishing foul air as the second-largest risk factor for premature death. (Source: Lancet)
Macroeconomic Output Losses: Forgone labor productivity and morbidity costs drained $6.8 billion from the economy in 2019, equivalent to 1.36% of India's Gross Domestic Product (GDP), eroding national capital formation. (Source: Lancet)
Inter-State Economic Disparities: Economic output losses as a proportion of state domestic product reached 2.15% of GDP in Uttar Pradesh and 1.95% of GDP in Bihar, while Delhi suffered the highest per-capita loss at $62 per person. (Source: Lancet)
Public Health Emergency: PM2.5 concentrations in the Indo-Gangetic Plain (IGP) exceed World Health Organization (WHO) guidelines of 5 µg/m³ by over 20 times, driving 32.5% of pollution deaths through Chronic Obstructive Pulmonary Disease (COPD) and 29.2% via Ischemic Heart Disease.
What Are The Primary Sources Driving PM2.5 Pollution?
Industrial and Power Sector Emissions: Coal-fired thermal power plants and brick kilns generate 51% of national industrial air emissions, releasing 90% of atmospheric SO2 and 52% of NOx emissions across major industrial corridors. (Source: CPCB Report)
Vehicular Transportation: Motor vehicles contribute 20% to 30% of urban ambient PM2.5 and generate 83% of urban Carbon Monoxide (CO) due to high fleet density and legacy non-compliant BS-IV commercial automobiles.
Agricultural Stubble Burning: Post-monsoon paddy residue burning in Punjab and Haryana contributes 20% to 45% of Delhi's peak winter PM2.5 levels, accelerated by squeezed harvesting windows mandated under the Punjab Preservation of Subsoil Water Act, 2009.
Household Biomass Combustion: Solid fuel reliance for cooking in rural households causes 610,000 deaths annually and serves as the primary regional source of toxic Black Carbon across northern plains. (Source: Lancet)
Steps Taken By Government To Address Air Pollution
National Clean Air Programme (NCAP): Launched by the Ministry of Environment, Forest and Climate Change, it aims to reduce particulate matter (PM₁₀ and PM2.5) levels by 40% or reach 60 μg/m³ across 131 targeted non-attainment cities.
Commission for Air Quality Management (CAQM): Established to coordinate, monitor, and take measures for air quality management across the National Capital Region (NCR) and adjoining areas.
Environment (Protection) Act, 1986 & Air (Prevention and Control of Pollution) Act, 1981: Serves as the primary legal and regulatory foundation allowing central and state pollution control boards to enforce emission limits.
Vehicular and Mobility Measures
-
BS-VI Emission Norms: Transitioned the entire country directly from BS-IV to BS-VI fuel and vehicle emission standards to sharply cut sulfur and nitrogen oxide emissions.
-
FAME Scheme: Provided financial incentives and subsidies to accelerate the adoption of electric vehicles (EVs), electric buses, and two-wheelers.
-
Ethanol Blending and Cleaner Fuels: Mandated the blending of ethanol in petrol and promoted compressed natural gas (CNG) and cleaner fleets for public transportation.
-
No PUC, No Fuel Initiative: Enforced rules blocking vehicle owners from purchasing fuel at petrol pumps without a valid Pollution Under Control (PUC) certificate.
Industrial and Energy Controls
-
Online Continuous Emission Monitoring Systems (OCEMS): Mandated real-time tracking for highly polluting industrial units.
-
Bans on Dirty Fuels: Prohibited pet coke and furnace oil in the NCR and pushed industries to shift toward piped natural gas (PNG).
-
Renewable Energy Expansion: Set large-scale renewable and solar capacity targets to reduce dependence on coal-fired thermal generation.
Seasonal and Dust Mitigation Actions
-
Graded Response Action Plan (GRAP): Implements a staged emergency response in Delhi-NCR during winter months—including halting non-essential construction, restricting high-polluting trucks, and deploying anti-smog guns and mechanical road sweepers.
-
Crop Residue Management: Subsidizes stubble-management machinery (such as Happy Seeders) for farmers in Punjab, Haryana, and Uttar Pradesh to reduce open-field burning.
Why The National Clean Air Programme (NCAP) Failed To Deliver Results?
Misaligned Coarse Particulate Focus: The National Clean Air Programme (NCAP) legally mandates tracking PM10 reduction rather than ultrafine PM2.5, ignoring microscopic soot particles that enter the bloodstream and respiratory tract.
Exclusion of Non-Urban Regional Sources: NCAP targets only 131 non-attainment cities, ignoring the fact that 70% of PM2.5 emissions originate from non-urban rural areas outside municipal limits
Skinned Capital Misallocation: Out of ₹13,415 crore released via 15th Finance Commission grants, municipalities allocated 68% of funds to road dust sweeping, while directing less than 1% to industrial pollution and household clean fuel transitions.
Absence of Statutory Penalties: The enforcement apparatus under the Air (Prevention and Control of Pollution) Act, 1981 lacks fiscal penalty mechanisms against urban local bodies, causing process compliance without air quality gains.
What Challenges Hinder Air Quality Governance?
Administrative Misalignment in Performance Rankings: Current municipal evaluation methodologies reward administrative checklists rather than tangible reductions in particulate concentrations.
-
Example: Swachh Vayu Sarvekshan Evaluation 2026, actual reduction in particulate matter accounts for merely 2.5% of a city's total score, allowing Lucknow to rank as the top million-plus city despite its annual average PM10 level of 135 µg/m³ remaining double the National Ambient Air Quality Standard (NAAQS) threshold of 60 µg/m³.
Fragmented Regional Airshed Governance: Environmental regulators operate within isolated city boundaries, failing to address transboundary pollution flows that cross state borders.
-
Example: CSTEP Assessment, fewer than 7% of 131 targeted cities achieved the mandated 40% PM10 reduction target because municipal authorities possess no statutory jurisdiction to regulate upwind industrial or agricultural emissions beyond municipal limits.
Capital Underutilization and Skewed Spending: Public clean-air grants remain bottlenecked due to weak administrative capacity in urban local bodies.
-
Example: CREA Progress Report 2026, urban local bodies utilized only 74% of total NCAP funds, spending ₹9,122 crore on mechanical road sweepers while domestic clean fuel transitions and industrial monitoring received under 1% of overall funds.
Way Forward
Transboundary Airshed Institutional Reform: Establish legally binding, inter-state airshed management authorities across the Indo-Gangetic Plain to replace isolated city plans.
-
Example: Uttar Pradesh Clean Air Management Program (UPCAMP), a $299.66 million World Bank funded multi-sectoral initiative deploying 15,000 electric three-wheelers, transitioning 3.9 million households away from solid biomass cooking fuels via Pradhan Mantri Ujjwala Yojana (PMUY) micro-financing, converting 700 brick kilns to zig-zag technology, and adding 200 air monitoring stations.
Digital Logistics and Custom Hiring Networks for Crop Residue: Deploy transparent e-governance applications to connect smallholder farmers with Crop Residue Management (CRM) machinery rentals.
-
Example: Krishi Yantra Mobile Application / Haryana Model, a digital machinery aggregator co-developed with Deloitte that enables real-time booking of Happy Seeders and Super Seeders, achieving a 54% verified reduction in stubble burning incidents across high-density paddy belts.
Ecological Barrier Infrastructure: Construct landscape-scale afforestation corridors to intercept desert dust movement and capture airborne fine particulates.
Example: Great Green Wall of Aravalli Initiative, a 1,600 km long and 5 km wide green ecological corridor planting 1.35 billion native trees across Gujarat, Rajasthan, Haryana, and Delhi to block windblown Thar desert dust and absorb industrial soot.
Conclusion
India must transition from fragmented municipal dust-sweeping metrics to an enforceable, airshed-wide governance framework that prioritizes PM2.5 reduction under NCAP 2.0 to uphold Article 21 fundamental rights, safeguard public health, and protect national economic capital.
Source: INDIANEXPRESS
|
PRACTICE QUESTION Q. Examine the economic cost of air pollution on India's growth ambitions, evaluating how clean energy transitions in household cooking and transport yield co-benefits for public health. 150 words |