Why In News?
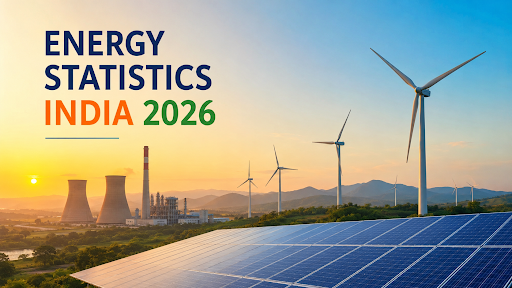
The National Statistics Office (NSO) released the Energy Statistics India 2026 report.
About Energy Statistics India Report
It is an annual, centralized government database tracking reserves, installed capacity, production, consumption, and trade of all energy commodities across India.
It covers both conventional fossil fuels (coal, oil, natural gas) and renewable energy sources (solar, wind, hydro, biomass).
Key Highlights of Energy Statistics India 2026
Growth in Total Primary Energy Supply (TPES)
-
India records a 2.95% expansion in its Total Primary Energy Supply (TPES) for FY 2024-25.
-
The TPES stands at 9,32,816 Kilo Tonnes of Oil Equivalent (KToE) or 39,055 Petajoules, reflecting healthy economic activity and rising energy demands.
-
The per-capita energy consumption also shows steady growth, rising to 18,096 Mega Joules per person in 2024-25.
Renewable Energy Potential
-
India's total renewable energy potential hits a staggering 47,04,043 Megawatts (MW) as of March 2025.
-
Solar energy dominates, holding approximately 71% of this total potential (33,43,378 MW).
-
India now ranks 3rd globally in Renewable Energy Installed Capacity, surpassing Brazil, with 250.52 GW of pure renewables and a total of 283.46 GW of non-fossil capacity.
-
Geographical Concentration: Over 70% of the renewable potential exists in just six states: Rajasthan (23.70%), Maharashtra (14.26%), Gujarat (9.10%), Andhra Pradesh (9.1%), Karnataka (8.59%), and Madhya Pradesh (8.09%).
Improved Statistical Coverage
-
The 2026 edition introduces data on the Credit Flow to domestic energy sectors, which grew over sixfold to ₹10,325 crore in 2025, showing high investor confidence.
-
It utilizes the Annual Survey of Industries (ASI) database to close data gaps regarding industrial consumption of coal and electricity.
-
The report now aligns end-use consuming sectors with international standards and includes international marine and aviation bunker data.
Major Challenges Facing India's Energy Sector
Surging Energy Demand: India's Total Final Consumption (TFC) of energy surges by 30.41% from FY 2015-16 to reach 6,08,578 KToE in FY 2024-25, while peak electricity demand hits a record 245 GW in Q4 2025-26.
High Import Reliance: Despite green energy growth, India exhibits a consistent rise in crude oil and natural gas supply, indicating heavy reliance on energy imports to meet domestic demands.
Coal-Dominated Energy Mix: Coal continues to dominate the landscape, with supply increasing to 5,52,315 KToE in FY 2024-25, representing 43% of installed capacity and 73% of electricity generated in Q4 2025-26.
Severe Renewable Curtailment: The grid struggles to absorb green energy during peak hours, leading to the curtailment of 26.6 GW of solar and 3.6 GW of wind generation in Q4 FY 2025-26, including 18 GW of solar curtailment at the Khavda station in Gujarat.
Storage and Transmission Deficits: While India issues tenders for 111 GWh of Battery Energy Storage Systems (BESS), only 1.2 GWh is currently operational, causing grid instability due to the variable nature of solar and wind power.
Measures to Strengthen Energy Sector
Decentralize Renewable Deployment: Expand renewable energy projects to states outside the top six to ensure balanced regional energy security and reduce long-distance transmission burdens.
Enhance Energy Efficiency: Deploy smart meters and digital billing systems to reduce Transmission and Distribution (T&D) losses to single digits from the current 17% (down from 22%).
Diversify the Energy Mix: Transition away from coal requires heavy investments in natural gas, green hydrogen hubs (such as Kandla and Tuticorin), and offshore wind.
Modernize Grid and Storage: Implementing the Generation Adequacy Study roadmap helps build 174 GW / 888 GWh of energy storage (including Pumped Storage and BESS) by 2035-36 to eliminate renewable energy curtailment.
Enhance Data Quality: Expanding real-time tracking platforms like the Renewable Energy Equipment Import Monitoring System (REEIMS) prevents supply chain bottlenecks and tracks import reliance.
Expand Domestic Manufacturing: Supporting localized production through PLI schemes expands India's Solar Module Manufacturing Capacity from 2.3 GW in 2014 to 172 GW in 2026.
Enforce Virtual Power Purchase Agreements (VPPAs): Allowing industrial consumers to meet green obligations efficiently via open market mechanisms under CERC guidelines accelerates private participation.
Rationalize Tariffs: Introducing cost-reflective electricity tariffs combined with Direct Benefit Transfers (DBT) rescues DISCOMs from financial stress caused by cross-subsidization.
Conclusion
The Energy Statistics India 2026 report demonstrates India's successful, data-driven scaling of renewable capacity while highlighting the urgent need for grid modernization and storage to overcome persistent coal reliance.
Source: pib
|