Why In News?
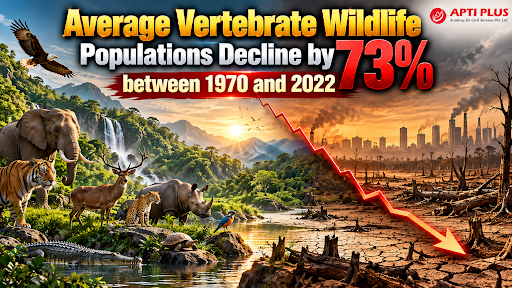
The World Wide Fund for Nature (WWF) released the Living Planet Report 2026, revealing a 73% average decline in monitored wildlife population sizes across 35,803 populations of 5,790 vertebrate species between 1970 and 2022.
What is the Living Planet Index (LPI)?
Produced by the Zoological Society of London (ZSL) in partnership with WWF, the Living Planet Index (LPI) tracks changes in the relative abundance of wild vertebrate species over time.
It monitors population trends across five major vertebrate groups: mammals, birds, fish, reptiles, and amphibians.
Rather than counting individual animals, the LPI tracks percentage changes in monitored populations across terrestrial, freshwater, and marine biomes globally, serving as an early-warning barometer of ecosystem health and extinction risk.
What Does the 73% Decline Actually Mean?
-
Average Proportional Change: The 73% figure represents the average proportional decline in monitored population sizes over a 52-year period (1970–2022).
-
Not Total Animal Loss: It does not mean that 73% of all individual wild animals on Earth have died or vanished.
-
Not Species Extinction Percentage: It does not mean that 73% of global species have disappeared or gone extinct.
-
Mathematical Weighting: The index averages percentage changes across monitored populations regardless of absolute population size; a drop from 200 to 100 individuals is calculated as a 50% decline, just as a drop from 20,000 to 10,000.
Which Ecosystems and Regions Showed the Greatest Wildlife Decline?
-
Freshwater Ecosystems: Suffered the most catastrophic loss, with monitored populations declining by 85% on average.
-
Terrestrial Ecosystems: Experienced an average population decline of 69%.
-
Marine Ecosystems: Recorded an average decline of 59%.
-
Regional Disparities: The steepest regional decline occurred in Latin America and the Caribbean at 95%, followed by Africa at 76–80%, Asia and the Pacific at 49–60%, North America at 28–39%, and Europe and Central Asia at 23–35%.
What Are the Major Drivers of Biodiversity Loss?
-
Habitat Loss and Degradation: Primarily driven by land conversion for unsustainable agriculture and deforestation, threatening over 85% of species at risk of extinction.
-
Overexploitation: Direct overharvesting, poaching, and unsustainable commercial fishing bycatch.
-
Climate Change: Alters temperature and precipitation patterns, confusing migration signals and pushing ecosystems toward irreversible tipping points.
-
Pollution: Chemical waste, plastic pollution, and atmospheric nitrogen deposition degrade air, soil, and aquatic habitats.
-
Invasive Species & Pathogens: Introduced species compete with or prey upon native wildlife, spreading novel diseases across biomes.
-
Systemic Root Causes: Driven by unsustainable food and agriculture systems, fossil fuel energy production, and a financial system that directs trillions in capital toward nature-harming activities.
Why is Biodiversity Important for the Economy and Human Well-Being?
-
Economic GDP Dependency: Over 55% of global Gross Domestic Product (GDP)—equivalent to US$58 trillion—is moderately or highly dependent on nature and ecosystem services.
-
Crop Pollination: Pollinators sustain agricultural production worth US$235–577 billion annually.
-
Ecosystem Services: Underpins clean water filtration, fertile soil formation, carbon sequestration, climate regulation, and natural disaster protection against coastal flooding and storms.
-
Livelihoods & Medicine: Provides foundational resources for global food security, pharmaceutical development, and forestry and fisheries livelihoods.
What Are the Positive Findings in the Living Planet Report?
-
50% of Monitored Populations are Stable or Increasing: Around half of the vertebrate populations tracked in the LPI show stable or positive population trends, demonstrating that decline is not universal or inevitable.
-
Conservation Successes at Scale: Sustained protection efforts have triggered species recoveries, including wild tigers in India, green sea turtles in Florida, Eurasian beavers in Europe, and managed marine fish stocks.
-
Positive Tipping Points: Coordinated policy and financial shifts in energy, agriculture, and finance can cross thresholds where nature restoration becomes fast, self-reinforcing, and economically advantageous.
What is the Way Forward for Biodiversity Conservation?
-
Protect and Restore Habitat: Fulfill the Kunming-Montreal Global Biodiversity Framework (GBF) targets to conserve 30% of lands and waters and restore 30% of degraded ecosystems by 2030.
-
Transform Food and Energy Systems: Shift agricultural subsidies away from environmentally harmful practices toward nature-positive agroecology, while accelerating clean renewable energy transitions.
-
Align Global Finance: Redirect capital away from destructive resource extractions and close the US$200 billion annual biodiversity funding gap.
-
Strengthen Freshwater Governance: Establish contiguous river corridors, remove redundant dams, and enforce legal protections under instruments like the Biological Diversity Act and transboundary watershed agreements.
Conclusion
Reversing global wildlife decline by 2030 requires transforming food, energy, and financial systems through sustained, nature-positive conservation to secure long-term ecological and economic resilience.
Source: INDIANEXPRESS
|
PRACTICE QUESTION Q. Which of the following best describes the 'Clustered Declines Hypothesis' in conservation biology? (a) The theory that global biodiversity loss is uniformly spread across all ecosystems due to global warming. (b) The statistical phenomenon where global average decline indices are heavily driven by extreme losses in a tiny fraction of populations rather than a widespread collapse across all species. (c) The ecological process where invasive species cluster in protected areas and outcompete native flora. (d) The statutory mandate under the Biological Diversity Act 2002 to group endangered species into regional biodiversity heritage sites. Answer: (b) Explanation: The Clustered Declines Hypothesis (Leung et al., Nature 2020) proves that global mean decline estimates in the Living Planet Index are driven by less than 3% of extreme outlier populations. Separating these outliers reveals that 98.6% of vertebrate populations remain stable, highlighting that severe declines are concentrated in specific vulnerable taxa like freshwater megafauna. |